
Electric Car Charging Costs Monthly Calculator: How to Budget Your Real 2026 Driving Costs
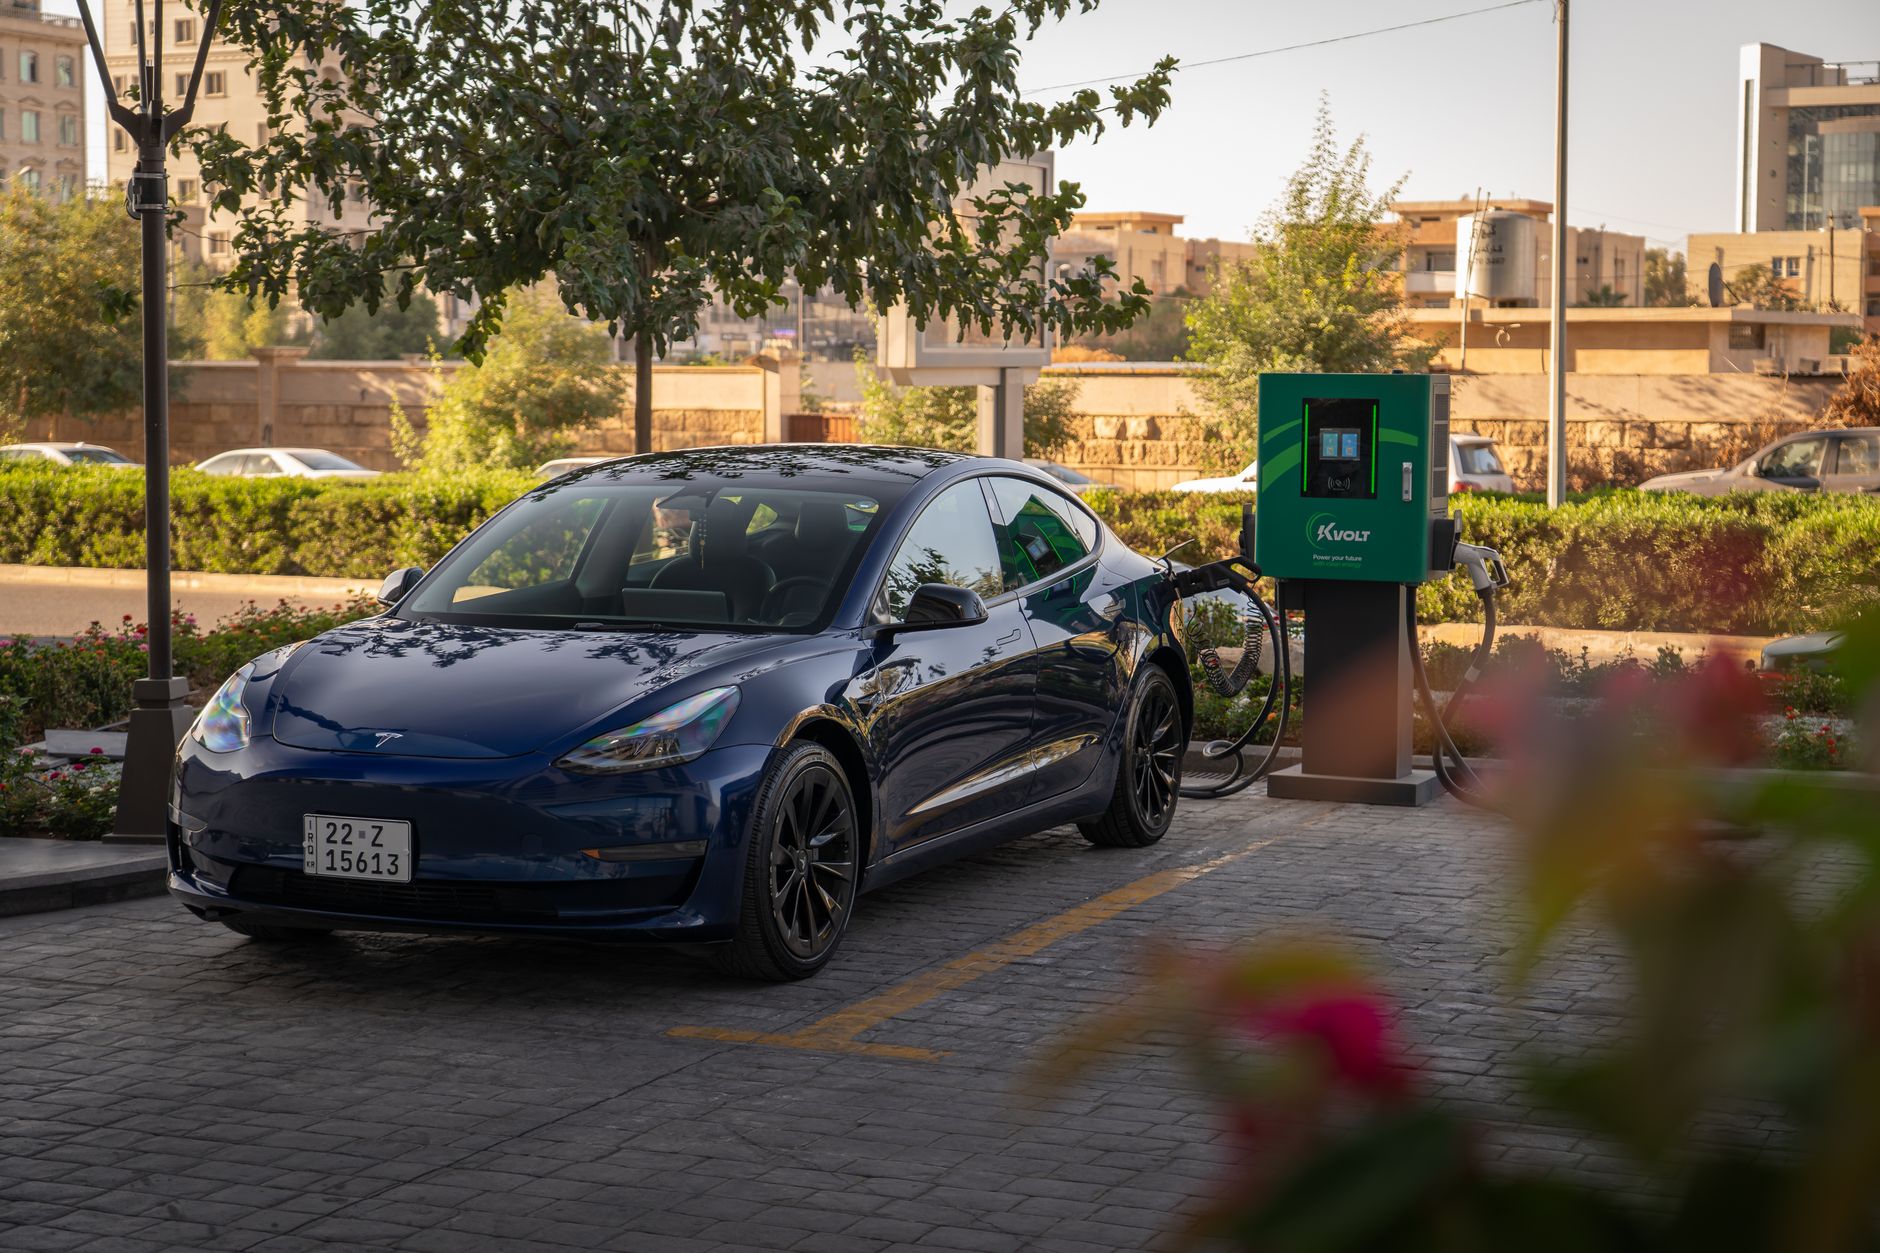
With electricity rates climbing nearly 8% nationwide this summer and more EV owners charging during peak hours without realizing it, the “cheap to fuel” promise of electric cars is getting complicated. If you’ve recently switched to an EV—or you’re considering one for fall 2026—you’ve probably asked the same question: what will I actually pay every month to keep this thing charged?
That’s where building a personal electric car charging costs monthly calculator becomes essential. Not the generic online tools that spit out a national average, but a framework that accounts for your specific driving, your local utility’s time-of-use rates, and how you actually charge. Let’s build one together.
Why Most Online EV Cost Estimators Get It Wrong
Those slick calculators on manufacturer websites? They typically assume you’re paying the national average electricity rate of around 16 cents per kWh, charging exclusively at home, and driving exactly 12,000 miles per year. Reality is messier.
Consider Sarah, a 2026 Chevrolet Equinox EV owner in San Diego. Her utility, SDG&E, charges between 9 cents and 72 cents per kWh depending on the hour. She drives 45 miles daily for her commute but charges at work two days a week. A generic calculator told her she’d spend about $55 monthly. Her actual first three months? $89, $34, and $127. The swing came from summer peak rates, a road trip, and inconsistent workplace charging.
The problem isn’t the calculators themselves—it’s that electricity pricing has become as variable as airline tickets. Your electric car charging costs monthly calculator needs to capture that variability, not flatten it.
The Core Formula: Breaking Down Your Actual Costs
Here’s the foundation every accurate estimate starts with:
Monthly Charging Cost = (Miles Driven ÷ Vehicle Efficiency) × Price per kWh × Charging Location Mix
Let’s unpack each variable with real 2026 numbers.
Vehicle efficiency matters more than most buyers realize. The 2026 Hyundai Ioniq 6 achieves roughly 4.2 miles per kWh in mixed driving. The Ford F-150 Lightning? About 2.3 miles per kWh. That same 1,000 monthly miles costs 83% more to fuel in the truck.
Price per kWh is where you need homework. Check your utility bill for your actual rate structure, not the headline number. Many utilities now use:
- Time-of-use (TOU) plans: Off-peak midnight charging might run 12 cents/kWh; 6 PM peak could hit 55 cents
- Tiered rates: Cross a threshold and everything above costs more
- EV-specific plans: Some utilities offer discounted overnight rates if you install a separate meter
Charging location mix is the wildcard. The Department of Energy’s 2026 data shows home charging averages 16 cents/kWh nationally, but public DC fast charging runs 35-55 cents per kWh depending on network and membership status. If you’re using Superchargers for 30% of your energy, your blended rate jumps significantly.
Building Your Personalized Monthly Calculator
Let’s construct a practical electric car charging costs monthly calculator you can adapt month by month.
Step 1: Establish your baseline month Track one representative month precisely. Note:
- Starting and ending odometer readings
- Every charging session: location, kWh added, cost, time of day
- Any free charging (workplace, retail, included with parking)
Step 2: Categorize your charging into buckets
- Home overnight (off-peak)
- Home daytime (on-peak, if applicable)
- Workplace (free or subsidized)
- Public Level 2 (parking garages, shopping)
- DC fast charging (road trips, emergency)
Step 3: Calculate your blended efficiency Your car’s EPA rating is a starting point, but your real-world number matters. Take total miles driven divided by total kWh consumed from all sources. Most 2026 EVs fall 10-15% below their EPA rating in normal mixed driving.
Step 4: Project forward with variables Create a simple spreadsheet with these inputs:
- Expected monthly miles
- Percentage split across your charging buckets
- Rate for each bucket (check for seasonal changes—many utilities raise summer peak rates)
- Your real efficiency factor
Here’s a concrete example for a 2026 Tesla Model 3 owner in Phoenix with Arizona Public Service’s EV plan:
| Charging Source | % of Energy | Rate/kWh | Blended Contribution |
|---|---|---|---|
| Home midnight-5 AM | 60% | $0.055 | $0.033 |
| Home other hours | 15% | $0.24 | $0.036 |
| Workplace Level 2 | 20% | $0.00 | $0.00 |
| Supercharger road trips | 5% | $0.38 | $0.019 |
| Blended rate | $0.088/kWh |
At 1,200 miles monthly with 3.8 miles/kWh real efficiency: $28/month. But shift 20% more to daytime home charging, and that jumps to $47.
Hidden Variables That Blow Up Your Budget
Even careful calculators get surprised. Watch for these 2026-specific factors:
Utility rate restructurings are accelerating. Pacific Gas & Electric, Con Edison, and several Texas utilities have implemented or proposed new EV-specific tariffs this year. Some reward controlled charging through your EV’s API; others penalize peak-hour plug-ins harshly.
Public charging price inflation continues outpacing home rates. Electrify America raised membership prices in March 2026; Tesla’s Supercharger network now varies pricing by station demand dynamically. Your road trip month could cost 3x your normal spend.
Seasonal efficiency swings hit harder than expected. That Phoenix Model 3? Summer AC use drops efficiency to 3.2 miles/kWh, while mild March achieves 4.1. Your calculator needs seasonal adjustments, especially for heat-pump-less budget EVs.
Phantom charging costs add up: idle fees at busy Superchargers, session fees at some networks, parking charges at chargers that aren’t free. Budget 10% above your calculated energy costs for these friction losses.
Tools and Templates to Streamline Your Tracking
You don’t need to build everything from scratch. Several approaches work for different commitment levels:
Minimal effort: Use your EV’s app (most 2026 models now show charging costs if you input rates) and cross-check monthly against your utility bill. Tesla, Ford, and Hyundai apps have improved significantly here.
Moderate effort: The free version of ChargeLab or Optiwatt (Tesla-specific) automates much tracking. They pull your charging data, apply your utility’s actual rate structure, and flag expensive sessions. Optiwatt claims users save average $34 monthly by optimizing charge timing.
Maximum accuracy: A simple spreadsheet updated weekly. Overkill for some, but after six months you’ll have personalized efficiency data more accurate than any generic tool.
One pro tip: set a calendar reminder to review your electric car charging costs monthly calculator every quarter. Rate structures change, your driving patterns shift, and seasonal efficiency matters. The 15-minute update prevents the $127 surprise bill.
Conclusion
The “electricity is cheaper than gas” narrative remains broadly true in 2026, but the margin depends heavily on how you charge, not just what you drive. Building a personal electric car charging costs monthly calculator transforms vague promises into actionable budgeting.
Start with one month of precise tracking. Categorize your charging sources honestly. Apply your actual utility rates, not national averages. Adjust for your real efficiency and seasonal variations. The result isn’t just a number—it’s the confidence to charge strategically, choose the right utility plan, and avoid the peak-hour traps that catch too many new EV owners.
Your electric fueling costs are more controllable than gasoline ever was. But that control requires paying attention. The calculator is your tool; the savings are your reward.